$27.40 a Day: The Boring Math That Turns Into Half a Million Dollars
hatch
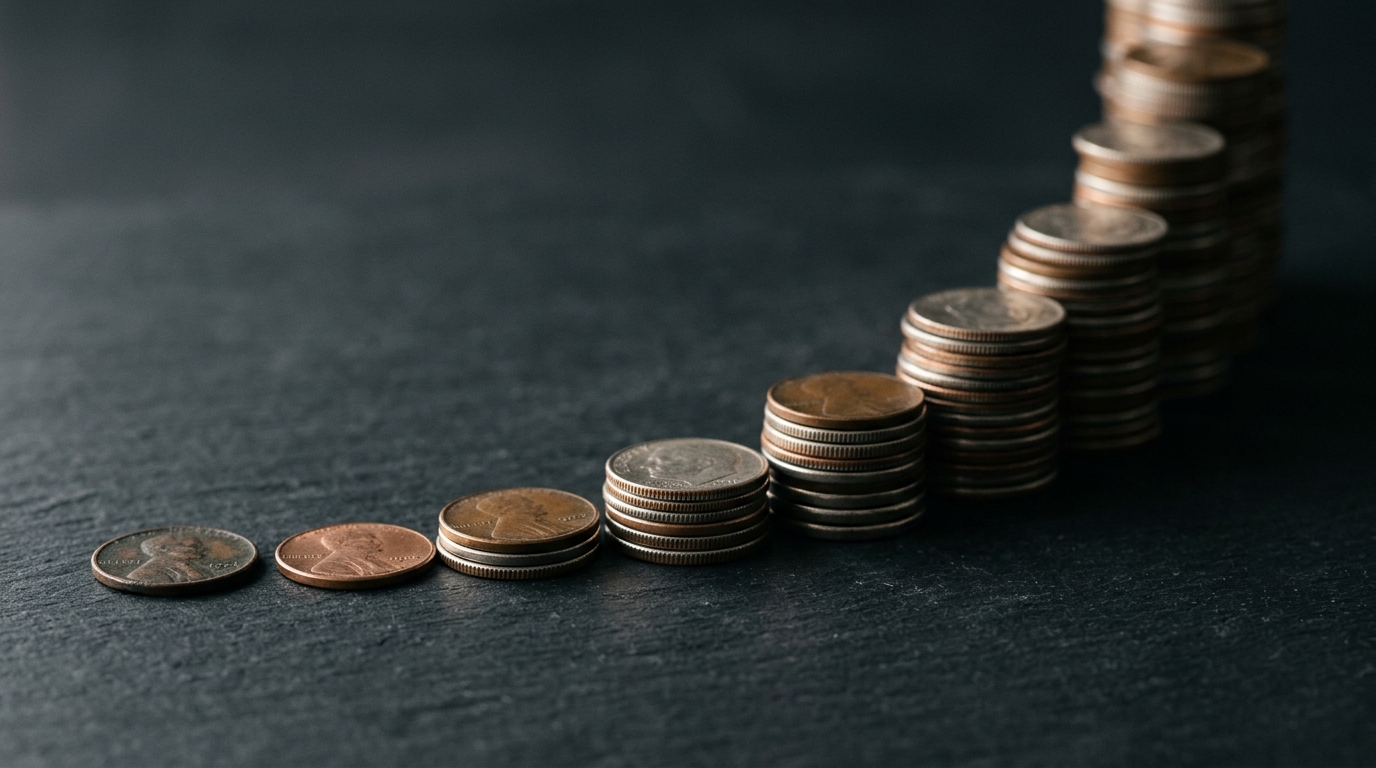
The most powerful number in personal finance isn’t a stock tip. It’s $27.40.
That’s what you get when you divide $10,000 by 365. One lunch out and a coffee. A couple of streaming subscriptions and a delivery fee. The kind of money that leaks out of a normal day without anyone noticing it’s gone.
A few months ago I built a little compound interest calculator to teach my 20-year-old sons about compound interest. I wanted them to see the curve instead of just hearing me talk about it. It worked well enough that I wanted to share it further. The thing that keeps grabbing me is how absurd the gap is between how small the daily number feels and how big the 20-year number gets.
So this post is that calculator, cut into pieces, with a story wrapped around it. Every widget below is live. Drag the sliders. Break the math. Check my work.
The fine print, up front: I am not a financial professional and this is not investing advice. I don’t know your situation, your taxes, your debts, or your risk tolerance. Real investments go up and down, sometimes a lot, and nothing here guarantees anything. This post is about the math, not about what you should buy.
Quick roadmap:
- Step 1: How $27.40 a day becomes $10,000 in one year
- Step 2: What happens if you invest that $10,000 and walk away (spoiler: less than you’d hope)
- Step 3: What happens if you invest it and keep the habit (this is where it gets stupid)
- The three moments in the math that genuinely surprised me
- What the calculator can’t tell you
Step 1: The jar
Forget investing for a second. Start with a jar.
Put $27.40 in it every day for a year. Here’s what that looks like as it fills up:
Step 1: One year of $27.40
Drag through the year. No interest, no investing, just a jar.
$27.40 times 365 is $10,001. About $192 a week. About $833 a month.
That’s the whole first step. No market, no interest rate, no cleverness. Just a year of not spending a specific, smallish amount of money. Is it painless? No. For a lot of people $833 a month is a real number, and I’m not going to pretend otherwise. But it’s a habit-sized number, not a lottery-sized one, and that distinction matters for everything that follows.
Step 2: Park it and walk away
Now you’ve got $10,000. The natural instinct is to invest it, feel responsible, and stop thinking about it.
Let’s see what that gets you. The calculator below assumes you invest the $10,000 and never add another dollar:
Step 2: Park the $10,000 and walk away
You stop saving after year one. The money just sits invested and compounds.
At 7% a year over 20 years, your $10,000 becomes about $40,000. At 8%, about $49,000.
That’s a 4x or 5x multiple for doing nothing, which is genuinely great. But I want to be honest about this part, because a lot of “the magic of compounding” content quietly skips it: a single year of saving, left alone for 20 years, does not make you half a millionaire. Not at any return you should plan around.
Here’s the thing. The headline number needs one more ingredient.
Step 3: Invest it and keep going
What if the $27.40 a day wasn’t a one-year challenge? What if it was just… what you do now?
Same setup: your first year’s $10,000 goes in as the starting balance, and you keep putting $27.40 a day in for the next 20 years. (The calculator spreads that $10,001 a year across monthly deposits and compounds monthly, same math as the original page.)
Step 3: Invest the $10,000 and keep the habit
Same $27.40 a day, every day, for the whole stretch. Move the rate and the years.
At 7%, you land at about $474,000. Nudge the return slider to 8% and you’re at about $540,000. Over half a million dollars, from a daily number smaller than a tank of gas.
And here’s the part that makes it work: you only put in about $210,000. The other $264,000 to $330,000 is interest. Money your money made.
| Return | You put in | Final balance (20 yrs) | Interest earned |
|---|---|---|---|
| 6% | $210,020 | $418,175 | $208,155 |
| 7% | $210,020 | $474,536 | $264,516 |
| 8% | $210,020 | $540,167 | $330,147 |
| 10% | $210,020 | $706,151 | $496,131 |
Monthly compounding, $10,000 starting balance plus $27.40/day. Illustrative only. Real returns are not smooth and are not guaranteed.
The three moments that surprised me
I’ve known the compound interest formula since school. Playing with the sliders still taught me things the formula never did.
1. Around year 10, your money starts out-saving you
At 7%, somewhere around year 10 the interest your balance earns in a single year becomes bigger than the $10,000 you’re contributing that year.
Read that again. You’re still dutifully setting aside $27.40 a day, and your money is quietly out-earning you. Every year after that, the gap gets wider. Your daily habit becomes the junior partner.
2. The last five years do the heavy lifting
At 8%, the balance at year 15 is about $321,000. At year 20 it’s about $540,000.
Those final five years add roughly $219,000. That’s about 40% of the ending balance, produced in the last quarter of the timeline. Same $27.40 a day the whole way through. Nothing changed except how long the pile had been growing.
This is why the chart looks like a hockey stick. It’s also why quitting at year 15 hurts way more than it feels like it should.
3. Time is the slider that matters most
Drag the Years slider in Step 3 to 30. At 7%, the same $27.40 a day crosses $1 million (about $1.1M). At 8%, about $1.35M.
Now drag it down to 10. About $164,000.
| Years of the habit | You put in | Balance at 7% | Balance at 8% |
|---|---|---|---|
| 10 | $110,010 | $164,348 | $174,667 |
| 20 | $210,020 | $474,536 | $540,167 |
| 30 | $310,030 | $1,097,909 | $1,351,448 |
Going from 20 years to 30 means putting in 48% more money. The ending balance goes up 2.3x at 7%, and 2.5x at 8%. The extra decade isn’t extra deposits. It’s extra compounding, and that’s a completely different animal.
Translation: The best time to start was 10 years ago. The second best time is before you finish reading this post.
What the calculator can’t tell you
I’d be doing the “viral finance math” thing badly if I didn’t say what this model leaves out. A smooth line on a chart is a lie of convenience. Specifically:
- Returns aren’t steady. The calculator assumes the same rate every single year. Real markets have years that are up 25% and years that are down 30%. The average might land somewhere similar over a long stretch, or it might not.
- Inflation is invisible here. $540,000 in 20 years will buy less than $540,000 buys today. The numbers above are nominal dollars.
- Taxes and fees exist. Depending on the account and what’s in it, both can take a real bite out of the final number.
- Life happens. Job loss, medical bills, a roof that picks the wrong winter. The habit only compounds if it survives.
None of that changes the core point. It just means the exact dollar figure is a sketch, not a promise. The shape of the curve is the lesson. The specific number at the end of it is not.
And one more time, because it matters: I’m not a financial professional, and this isn’t advice. If you’re making real decisions about real money, talk to someone who is qualified and knows your situation.
What to do next
- Play with the full calculator. It has more knobs than the versions above: starting amount, compounding frequency, a year-by-year table. Find your own $27.40.
- Find your number. Maybe it’s $10 a day. Maybe it’s $50. Slide the daily contribution and watch what 20 years does with it. The curve has the same shape at every size.
- Notice the leak. Before changing anything, just count what actually goes out on an ordinary day. Most people are surprised, in one direction or the other.
- Respect the time slider. If there’s one thing the math screams, it’s that when you start matters more than almost anything else you control.
Shareable soundbites
- “$27.40 a day is $10,000 a year. Twenty years of it, compounding, is a different life.”
- “Around year 10, your money starts out-saving you.”
- “One year of saving, left alone, gets you $40K. Twenty years of the habit gets you half a million. The habit is the asset.”
- “The last five years of a 20-year plan can produce 40% of the result. Don’t quit at year 15.”
- “Compound interest doesn’t reward the smart. It rewards the patient.”
Sources & further reading
- My compound interest calculator: The full interactive page these widgets were adapted from. Insight: Every number in this post can be reproduced there with a $10,000 starting balance, a $27.40 daily contribution, and monthly compounding.
- Investor.gov compound interest calculator: The SEC’s own calculator. Insight: A useful second opinion from a source with no product to sell you; plug in the same numbers and compare.
- The formula itself:
Balance = P(1 + r/n)^(nt) + (C/n) x [((1 + r/n)^(nt) - 1) / (r/n)], where P is the starting balance, r is the annual rate, n is compounding periods per year, t is years, and C is annual contributions. Insight: The exponent is what makes time the dominant variable. Double the deposits and you double that part of the result; extend the years and you raise the growth to a higher power.
How much is your daily leak, and what does it turn into on the slider? I’m curious what numbers people find.